Value is not created only because it helps someone do something
But also because it helps them look cool.
That coolness might stem from the fact that they are doing something very complicated or something very beautiful
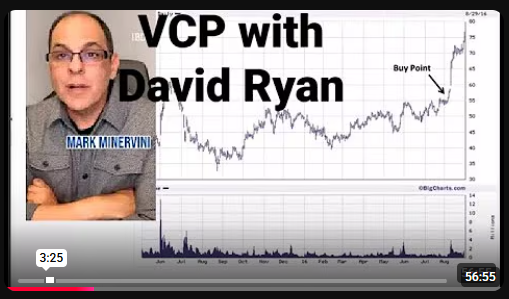
I have seen hundreds of reels where people are just larping as a quant or a trader or an entrepreneur by just showing fancy screenshot of R plots, IDE full of files and text, trading view graphs or ecom dashboards
An insight that people even if they don’t want to be that ‘worker’, They still want to look like they’re
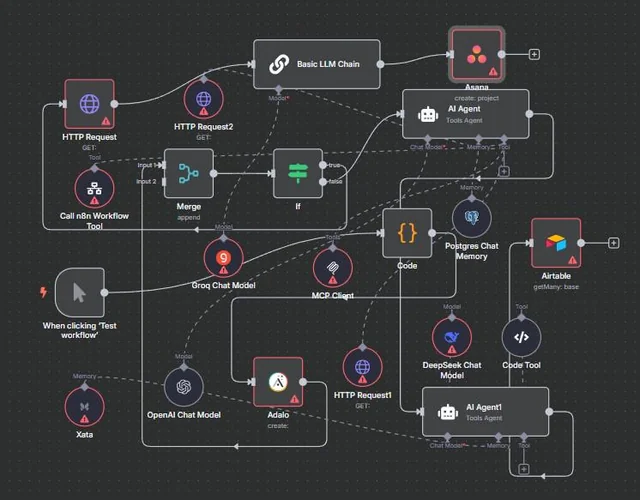
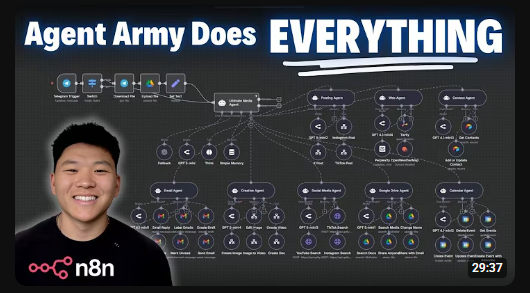
You will see people using N8N to make pointless automations but still it gets a lot of views because the N8N diagrams look so fucking cool
N8Nis not only generating value by making you automations but also making you look like you know a lot of shit
Same was the case with a notes manager called Obsidian
All the traction it got over years was because of one plugin that turned all your notes into a network diagram that looks extremely cool
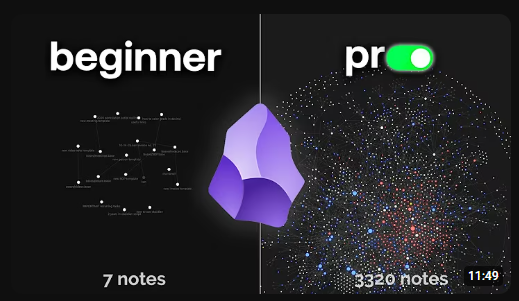
But from practical standpoint this shit has no fucking meaning
I can’t see any meaningful connections or even be able to read the names of the files
You’d have to put more effort into the organization of your ideas than actually working on them to make it work
But hey it looks cool as fuck and it made Youtube thumbnails perform a lot
It kind of looks like connected neurons and people started to make youtube videos
“hey I made Obsidian my second brain” and they would have graphs like this as their thumbnail
Your UI is not there only for the customer’s ease and experience but also performative tendencies
It is also there to create a viral movement for you
Something very shareable with the people, Something that makes the users look smart or cool on their social media
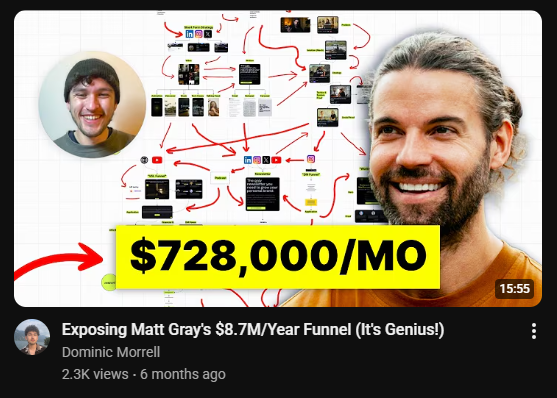

If it is something that looks complicated enough but attractive enough that can help them sell their courses or brand
They’re going to pay you even if they have no fucking use for it
Once again people don’t buy things just to get things done
They buy it to look cool too
To look smart, to look like an authority
The user might not even understand half of what’s on the screen.
But the artifact looks dense, intricate, and high-agency.
It resembles the visual language of people who operate at a higher tier.
So even if the underlying workflow is useless, the aesthetic feels aspirational.
That’s how you turn software into something aspirational, something that makes people feel smart just because they have it
There is demand for things that manufacture aesthetic proof of competence.
If you build a tool only for utility, you cap your growth.
If you build a tool that enhances identity, you create a movement.
Virality rarely comes from usefulness.
It comes from my ability to post a screenshot of it and look like a person who knows what they’re doing.
The whole consulting industry is based on this fact that it just looks smart and people will pay you even if your PPTs don’t do shit
Aspirational software doesn’t sell the outcome.
It sells the identity.
It gives the user a feeling that they’re stepping into a more capable version of themselves.
It also makes sharing those tools look really awesome.
After all what makes people share anything?
Its the feeling that they will look cooler smarter or funnier
And often the fastest way to deliver that feeling is through visual proof such as dense diagrams, structured dashboards, elegant automations, polished slides, or complex-looking systems.
It creates the aura of intelligence. Customers buy the aura.
If your UI acts as a status artifact, you expand from a tool into a cultural object.
Plus pure utility is a bad play for growth because if you’re so good then people deem it as competitive advantage that must not be disclosed
On the other hand if it makes it them look cool
They will share even if it is actually hampering their process
Optimize for shareability as social signal
This also explains why so many productivity tools have:
- Dark mode (looks professional in screenshots)
- Graph/network visualizations (looks connected” and systematic)
- Dense dashboards with lots of metrics (looks data-driven)
- Terminal-style interfaces (looks technical)
- Complexity that slightly exceeds the user’s understanding (aspirational gap)